
How to Calculate Engagement Rate: Formula, Worked Example and What Good Looks Like
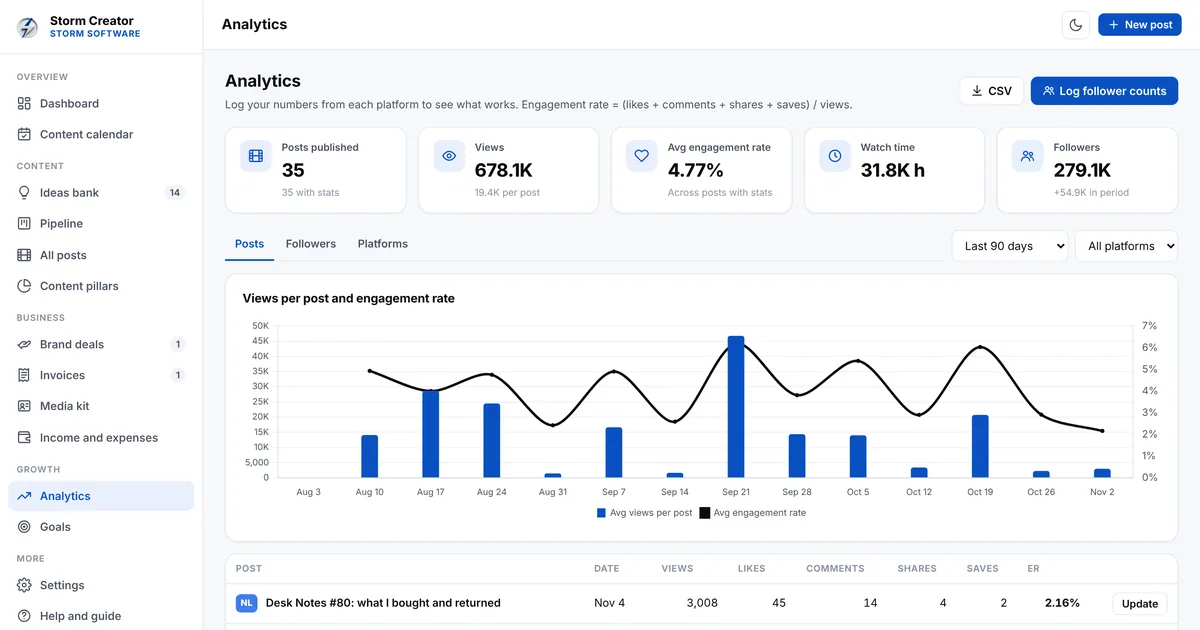
Engagement rate is the number brands ask for first and the one creators most often get wrong. The maths is simple, but the choices around it matter: which interactions you count, whether you divide by followers or by views, and what you compare the result with. This guide walks through the formula with a worked example, explains why benchmarks vary so much, and shows how to use your rate in pitches and pricing.
What engagement rate measures
Engagement rate shows how many people acted on your content compared with how many could have. A large following with little interaction is worth less to a brand than a smaller audience that comments, shares and saves.
It is a ratio, so it lets you compare posts of different sizes, track your own trend over time and give brands a figure they can compare across creators.
The basic formula
Add up the interactions on a post, divide by the size of the audience, and multiply by 100 to get a percentage.
Engagement rate = (likes + comments + shares + saves) / followers x 100. Some creators divide by views or reach instead, which we cover below.
- Likes: the quickest and lowest effort interaction
- Comments: a stronger signal that people cared enough to reply
- Shares: your content reaching new people
- Saves: people planning to come back to it
A worked example
Say a post gets 1,200 likes, 85 comments, 40 shares and 75 saves. That is 1,400 interactions. You have 25,000 followers, so 1,400 / 25,000 x 100 = 5.6%.
Now say the same post was seen by 18,000 people. Measured against views, the rate is 1,400 / 18,000 x 100 = 7.8%. Both numbers are correct. They answer different questions, so always say which one you are quoting.
Try your own numbers in our free engagement rate calculator. Switch between followers and views and see a rough guide to a sponsored post rate.
Followers or views
Dividing by followers is the common way to compare accounts, and it is what most brands expect in a media kit. It can look low on platforms where most views come from people who do not follow you yet.
Dividing by views or reach shows how well a post did with the people who actually saw it. It suits short video and any content that travels beyond your followers. Many creators track both and use followers for pitches and views for judging their own content.
Why benchmarks vary so much
You will find many different figures for a good engagement rate, and most of them are honest for the data they came from. Rates differ by platform, by niche, by post format and by account size. Smaller accounts usually see higher rates than large ones, and published averages shift each year as platforms change.
That makes a single target from the internet a poor guide. The most useful benchmark is your own average over the last three to six months, broken down by platform and by type of post.
Common mistakes
Small slips can make your rate look better or worse than it is, and brands notice when numbers do not line up.
- Mixing methods, such as followers one month and views the next
- Counting your own replies as comments
- Quoting your best post instead of an average
- Comparing a short video with a carousel without saying so
- Forgetting that giveaways inflate comments for a while
Using engagement in your media kit
A media kit should show followers, average views and engagement rate for each platform, plus who your audience is and what you have done for other brands. Use averages over a stated period, not your single best post, and keep them up to date.
Brands like to see a trend. A steady or rising rate over the last few months is often more convincing than one high number.
Engagement and sponsored post rates
There is no official price list for sponsored content. A common starting point is a set amount per 1,000 followers, raised when engagement is strong and lowered when it is weak. Treat that as a first number for a conversation rather than a final quote.
Then adjust for the work and the rights involved. Usage rights for paid ads, exclusivity that stops you working with competitors, extra deliverables and tight deadlines all justify a higher fee. Write these into the deal so both sides know what was agreed.
Track it without a spreadsheet maze
Working out engagement by hand for every post gets old quickly, and numbers scattered across notes and spreadsheets are hard to turn into a media kit.
Storm Creator works out the engagement rate on every post as you enter its stats, charts your follower growth, and pulls your averages straight into a media kit you can print or save as PDF. Brand deals, invoices and income sit in the same offline app.
See how Storm Creator plans your content, tracks brand deals and keeps your media kit current for $39 once, with no monthly fees.
If you invoice brands, read our guide to invoicing for small businesses.
The bottom line
Add up likes, comments, shares and saves, divide by followers or by views, and multiply by 100. Say which method you used, compare against your own average rather than a generic benchmark, and use the trend in your pitches. A clear, honest number is worth more to a brand than an impressive one that does not hold up.
Try our free engagement rate calculator.
You may also like: Storm Shop, Storm Photo, Storm Books